Annual Natural Gas Production (Northeast vs U.S.)
| Annual Dry Natural Gas Consumption (MCF) | |||
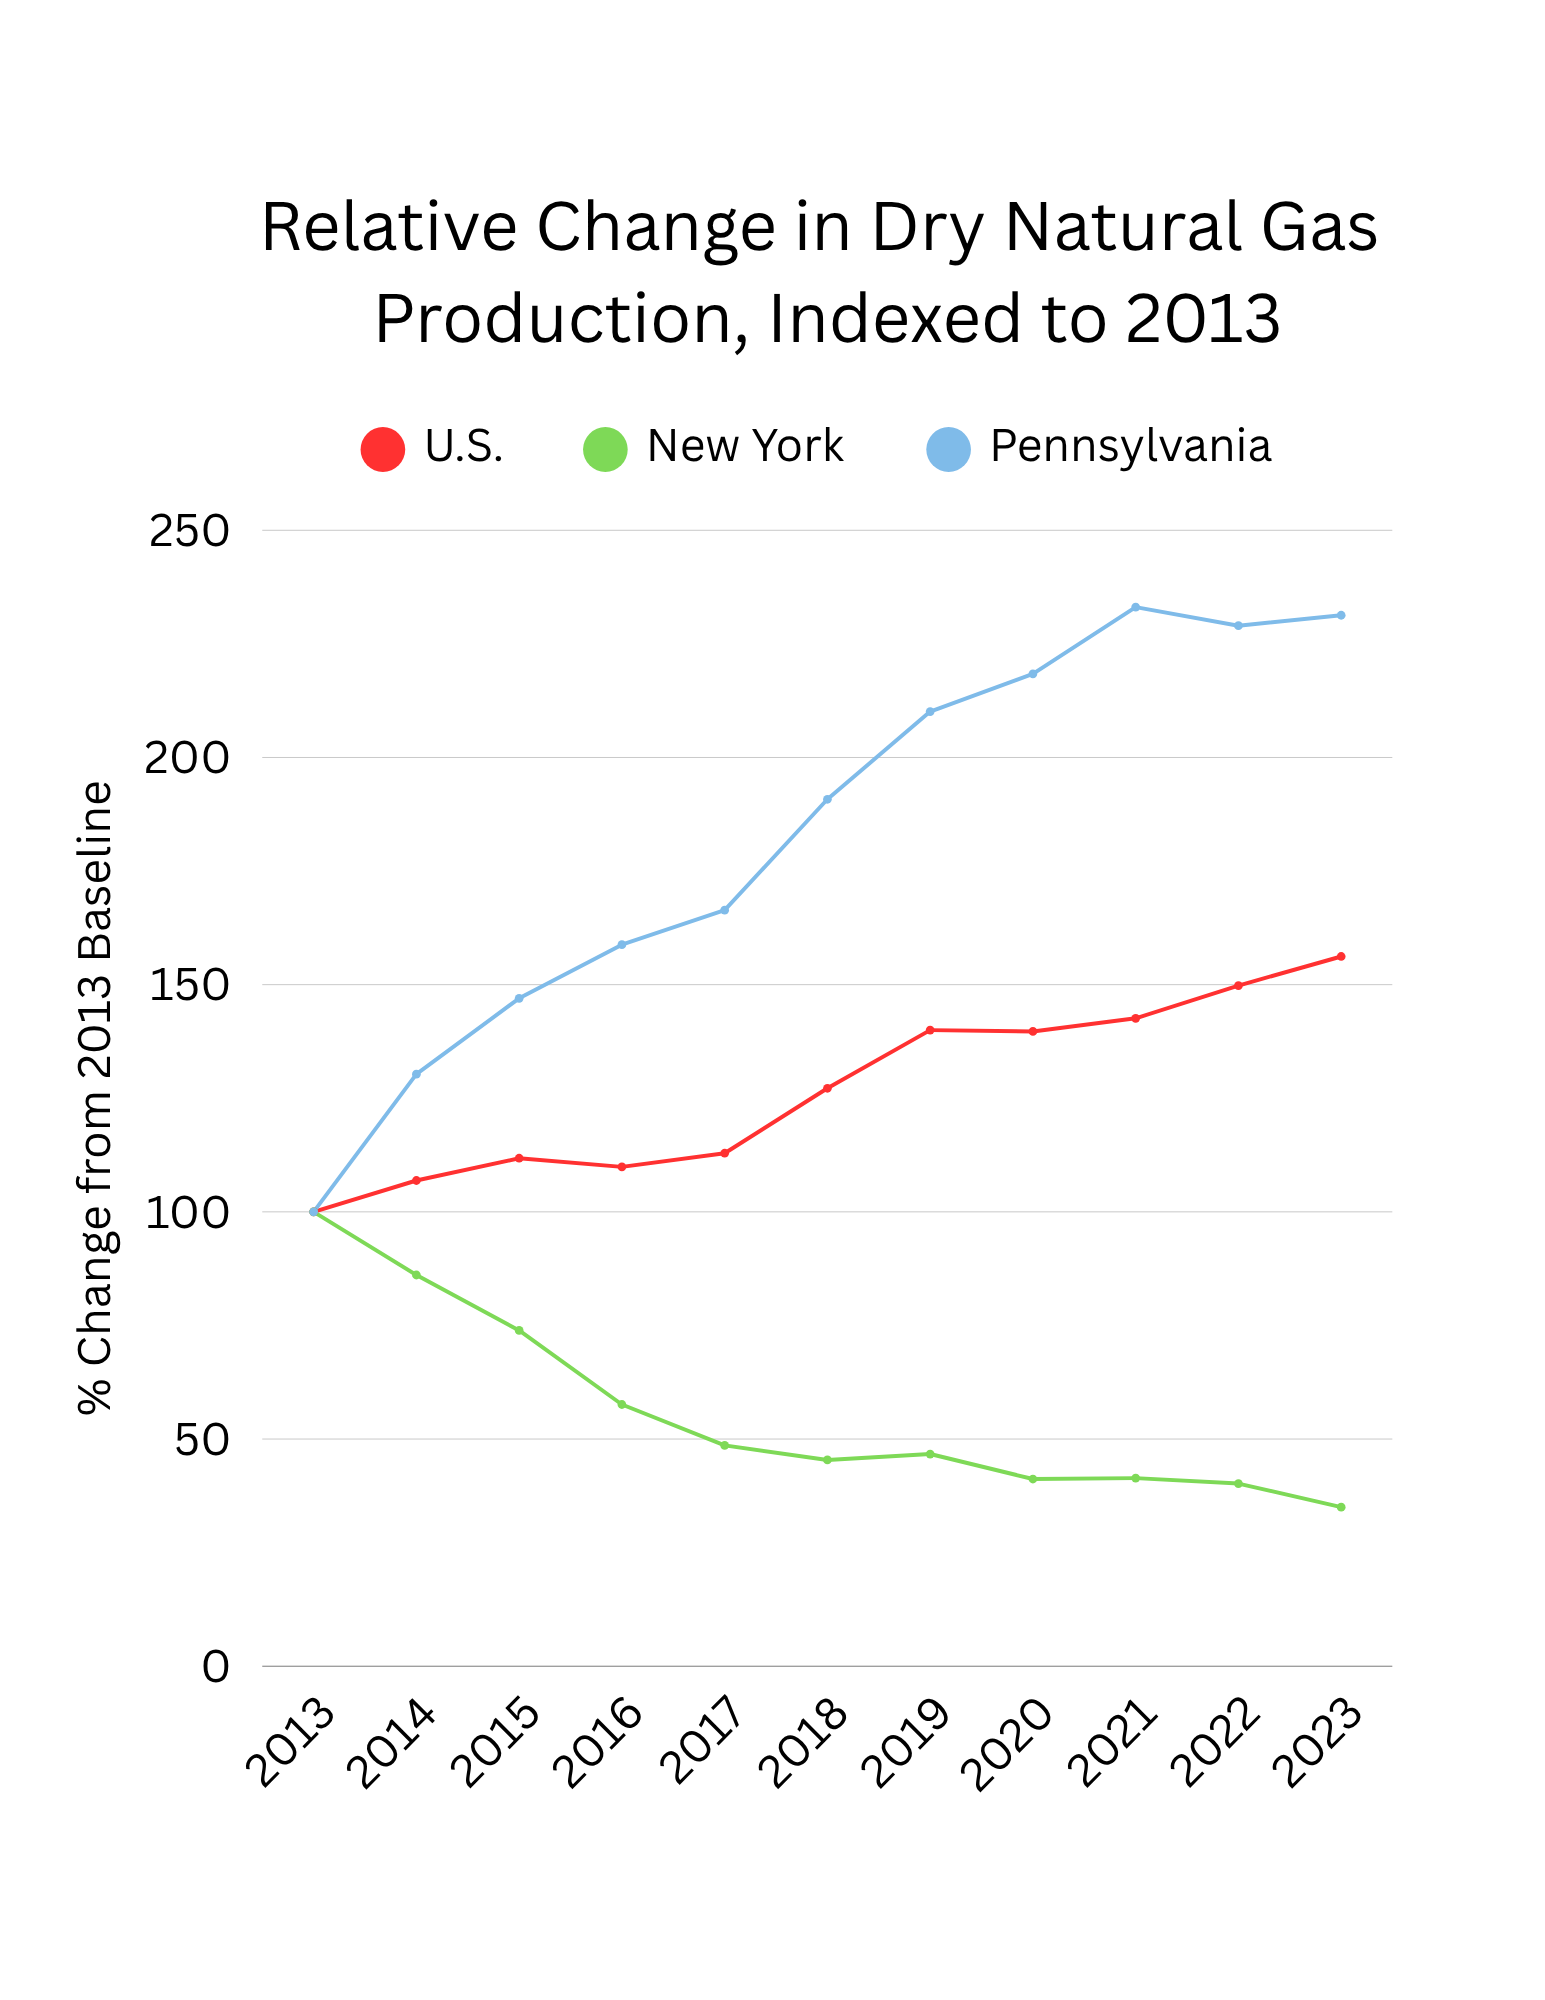
| Year | U.S. | New York | Pennsylvania |
| 2013 | 24,205,523 | 23,458 | 3,238,106 |
| 2014 | 25,889,605 | 20,201 | 4,217,704 |
| 2015 | 27,065,460 | 17,325 | 4,759,441 |
| 2016 | 26,592,115 | 13,523 | 5,141,435 |
| 2017 | 27,340,583 | 11,395 | 5,389,785 |
| 2018 | 30,774,274 | 10,653 | 6,177,088 |
| 2019 | 33,899,021 | 10,962 | 6,801,265 |
| 2020 | 33,811,129 | 9,657 | 7,071,040 |
| 2021 | 34,529,276 | 9,708 | 7,547,154 |
| 2022 | 36,254,942 | 9,441 | 7,415,506 |
| 2023 | 37,803,268 | 8,219 | 7,490,323 |